Tradeblyn User Manual
A trade journal and analytics tool for live, prop-firm and paper accounts. Import your history from a broker, record the context around each trade, and review what the results actually say.
Disclaimer. This application is a trade journaling and analytics tool designed to help you organise and review your own trading activity. It does not provide financial advice, trading recommendations, or any guarantee of future results. Every figure it shows is derived from data you supply and should be read on that basis.
Quick start
About ten minutes, start to finish.
| # | Step | Where |
|---|---|---|
| 1 | Create an account and enter the emailed 6-digit code | Start free, or /signup |
| 2 | Add a trading account, name it and pick the type | Settings → Accounts |
| 3 | Import your history, or add one trade by hand | Journal → Import CSV or + Add trade |
| 4 | Work the Needs review tab: playbook, tags, mistakes, context | Journal |
| 5 | Compare what you recorded | Analytics and Reports |
Steps 1 to 3 get data in. Steps 4 and 5 are the part worth repeating: the fields you fill in during review are exactly the ones you can compare later. A trade imported and never reviewed contributes a P&L figure and nothing else.
Contents
- Getting started
- Trading accounts
- Getting trades in
- The journal
- Home
- Reports
- Analytics
- Goals
- Journal library
- Settings
- Plan and billing
- Support
- Exporting your data
- Widget reference
- Known limitations
- Frequently asked questions
1. Getting started
Sign up
- Choose Start free on the home page, or go to
/signup. Enter your email, name and a password of at least 8 characters. - We email you a 6-digit code. Enter it to verify.
- You are in.
Your 24-hour trial starts when you verify, not when you register. Signing up at midnight and reading the email at 8am still gives you a full 24 hours. No card is required.
The trial
The trial is the complete product: every importer, every widget, no cap on accounts or trades.
A banner counts down the time remaining, in the accent colour above two hours and in red below it. When the time is up the app locks until you subscribe. Nothing you recorded is deleted, and you can export it at any point, including after the trial ends.
Signing in again
Sign in with your email and password. If you have two-factor authentication enabled you are asked for a code from your authenticator app, or one of your recovery codes. Forgotten passwords are reset by email from the sign-in page.
2. Trading accounts
An account is one place you trade: a broker account, a prop-firm evaluation, or a simulator. Keeping them separate stops one bad day in a simulator polluting your live statistics.
Settings → Accounts → Add account
Three types
| Type | For | What it changes |
|---|---|---|
| Live | Real money at a broker | P&L, R-multiples, the risk widgets |
| Prop | Evaluations and funded accounts | Adds drawdown limits, profit target, trading-day count and consistency tracking |
| Paper | Simulators and backtesting | The same analysis, marked so you never mistake it for live |
Choosing Prop reveals the fields your firm cares about: daily loss limit, max drawdown, profit target, minimum trading days and the consistency rule. Fill in whatever applies and Home tracks you against it.
Switching accounts
The account selector sits at the top of Home, the Journal, Imports and every report board, and your choice follows you between them. All accounts (Combined) aggregates everything and keeps its own saved layouts, so a combined view can be arranged differently from any single account.
3. Getting trades in
Three ways. Most people import, then review.
By hand
Journal → Add trade
Five fields are required: symbol, side, entry price, quantity and entry time. Everything else can wait for review.
Setting a stop loss is what makes R-multiples possible. Without one you get P&L but no R, and R is the more comparable number: it survives changes in position size, which raw currency does not.
The form also carries the context that makes the analytics worth reading: setup, timeframe, session, market condition, playbook, tags, and a psychology block (confidence, stress and focus on a 1 to 10 scale, plus sleep hours and the emotion you were trading on).
By CSV import
Journal → Import CSV, or the Imports page.
Drop the file in. The format is detected, you are shown exactly what will happen, and nothing is written until you confirm.
Recognised out of the box:
| Platform | What it reads |
|---|---|
| Zerodha | Console Tradebook |
| Tradovate | Trades export and raw order/execution export |
| MetaTrader 4 | Closed Transactions, and Deals/Orders |
| MetaTrader 5 | Positions, and Deals |
| cTrader | History, and raw fills |
| Topstep X | Trades and Orders |
| Match Trader | Closed positions and Orders |
| Quantower | Trades |
| Trading Technologies | Order History |
| Charles Schwab | Transaction history, options sized per contract |
| thinkorswim | The multi-section account statement |
| TradeStation | Execution history (beta) |
| Generic CSV | Any file with symbol, side, entry price, quantity and entry time |
Files that contain raw fills or orders rather than finished trades are reconstructed into round-trip trades, including scale-ins and scale-outs.
Two things to know before importing. TradeStation support is beta: its export format is not publicly documented, so the importer was built from inferred column layouts and has not been checked against a confirmed real export. And futures imported from Charles Schwab or thinkorswim are currently understated, because the contract multiplier is not applied. Equities and options from those two are unaffected. See Known limitations.
If the format is not recognised you go to manual column mapping, where you point each field at a column in your file. Save the mapping and the next file from that broker is one step.
Renaming a column in your export does not create a new field. The importer maps your columns onto a fixed set, and a column it does not recognise is ignored rather than added.
Duplicates are checked in two directions: against trades already in the account, and against other rows in the same file. Matches are listed in the preview, and importing them anyway is a decision you make at the confirmation step rather than something that happens quietly.
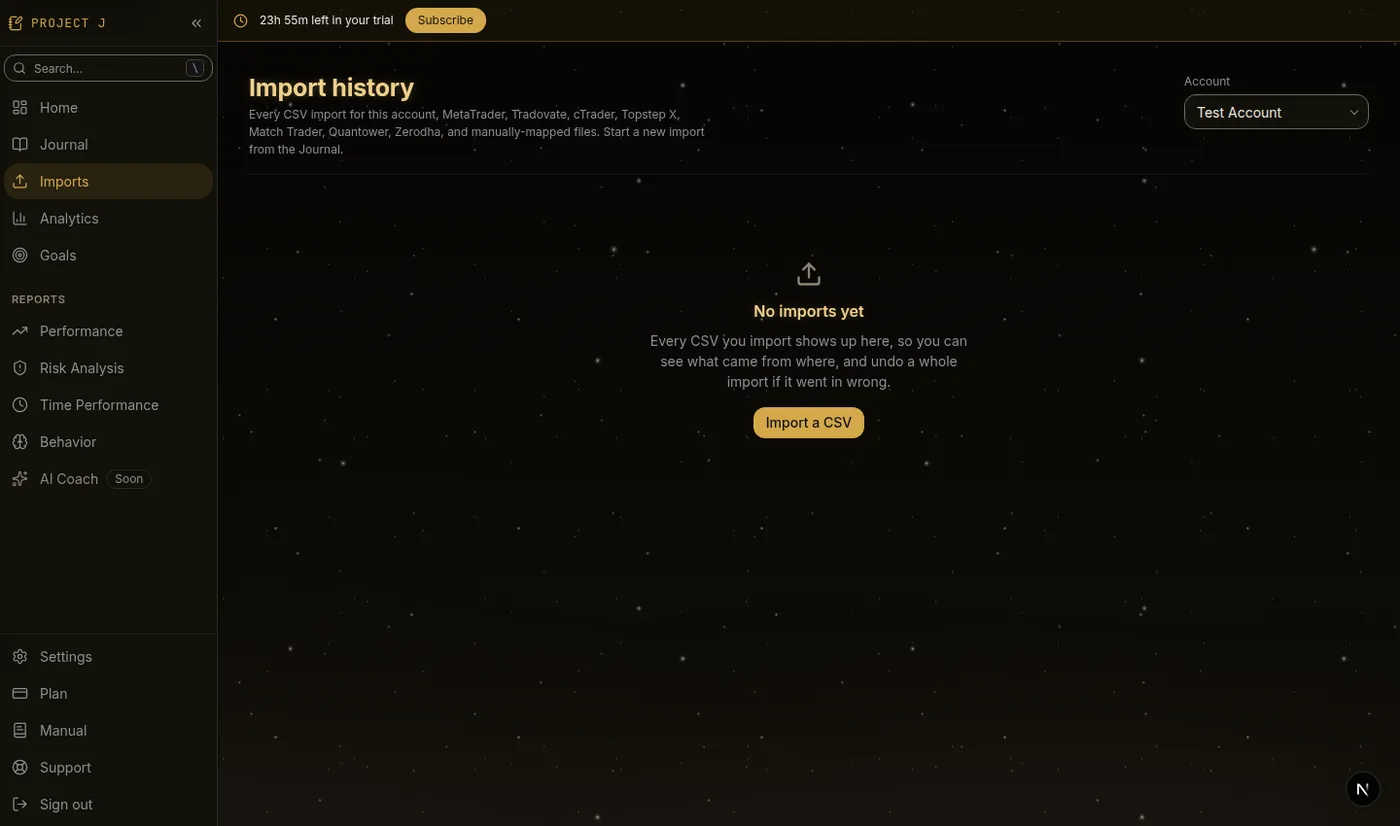
Every import is recorded under Imports, where you can see what was added and delete a whole batch as one unit.
By screenshot
Journal → Scan screenshot
Paste or upload a screenshot of an order ticket. Text is extracted and used to prefill the trade form. Check the values before saving: this is a convenience for typing, not a source of truth.
4. The journal
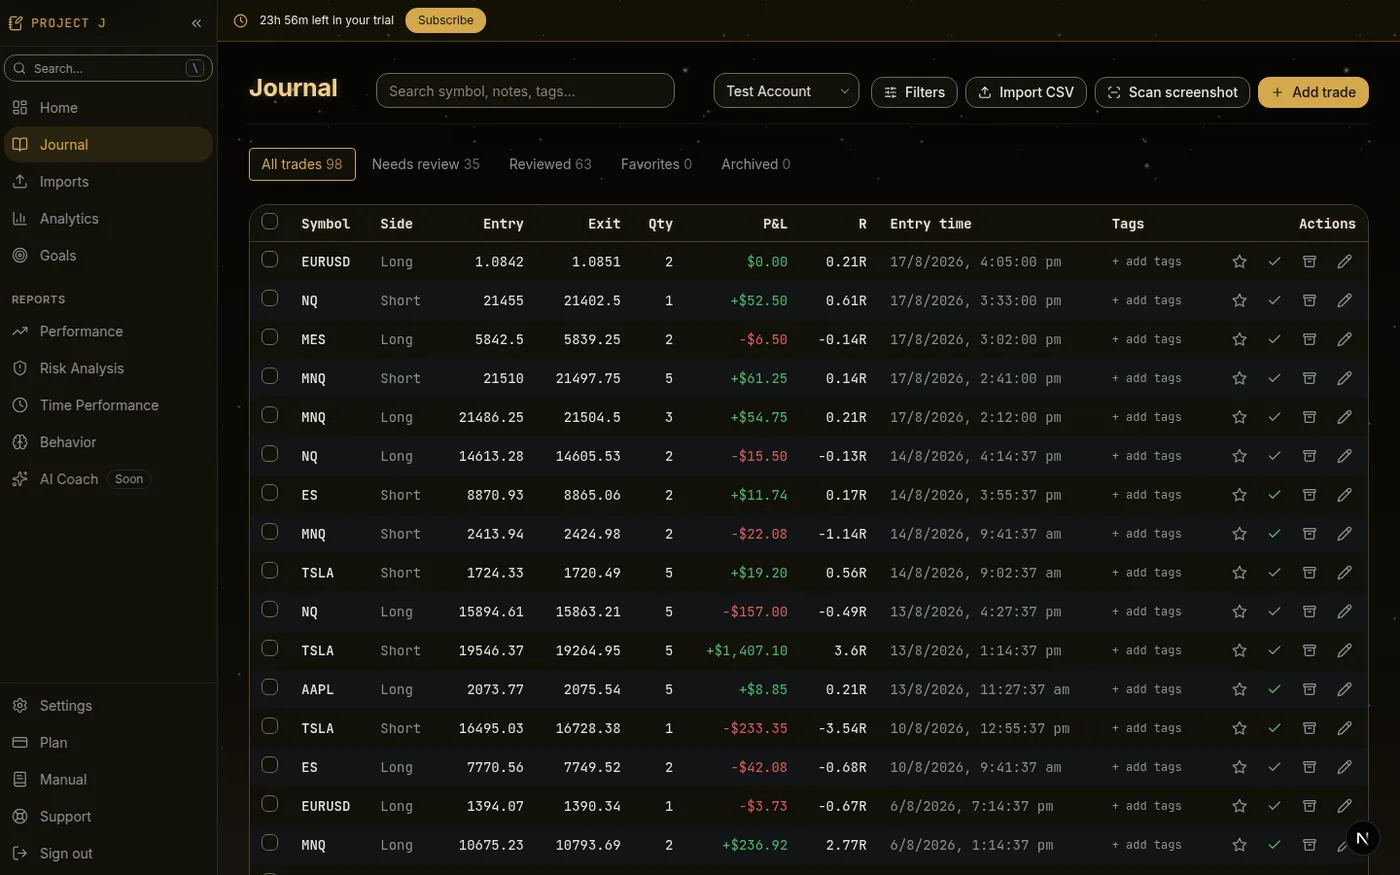
Journal is the full list of trades, and where reviewing happens.
The review workflow
Imported trades arrive unreviewed. The Needs review tab is the queue.
For each trade: attach a playbook, add tags, record any mistakes, and fill in the context and psychology fields. Mark it reviewed and it leaves the queue.
This is the step that pays for itself. Mistake analytics, emotion analytics, playbook comparisons and most of the cross-tab explorer are built from fields that only exist because you entered them.
Finding trades
Filter by account, date range, symbol, side, market type, instrument type, tag, playbook and review state. Sort any column. Select multiple rows for bulk actions: tag them, assign a playbook, set an emotion or grade, archive, export or delete as a group.
Trade detail
Opening a trade shows everything recorded against it, in tabs:
- General, the numbers: prices, size, fees, P&L, R-multiple.
- Journal, the context and psychology fields, plus your notes.
- Attachments, screenshots and files.
- History, what changed and when.
5. Home
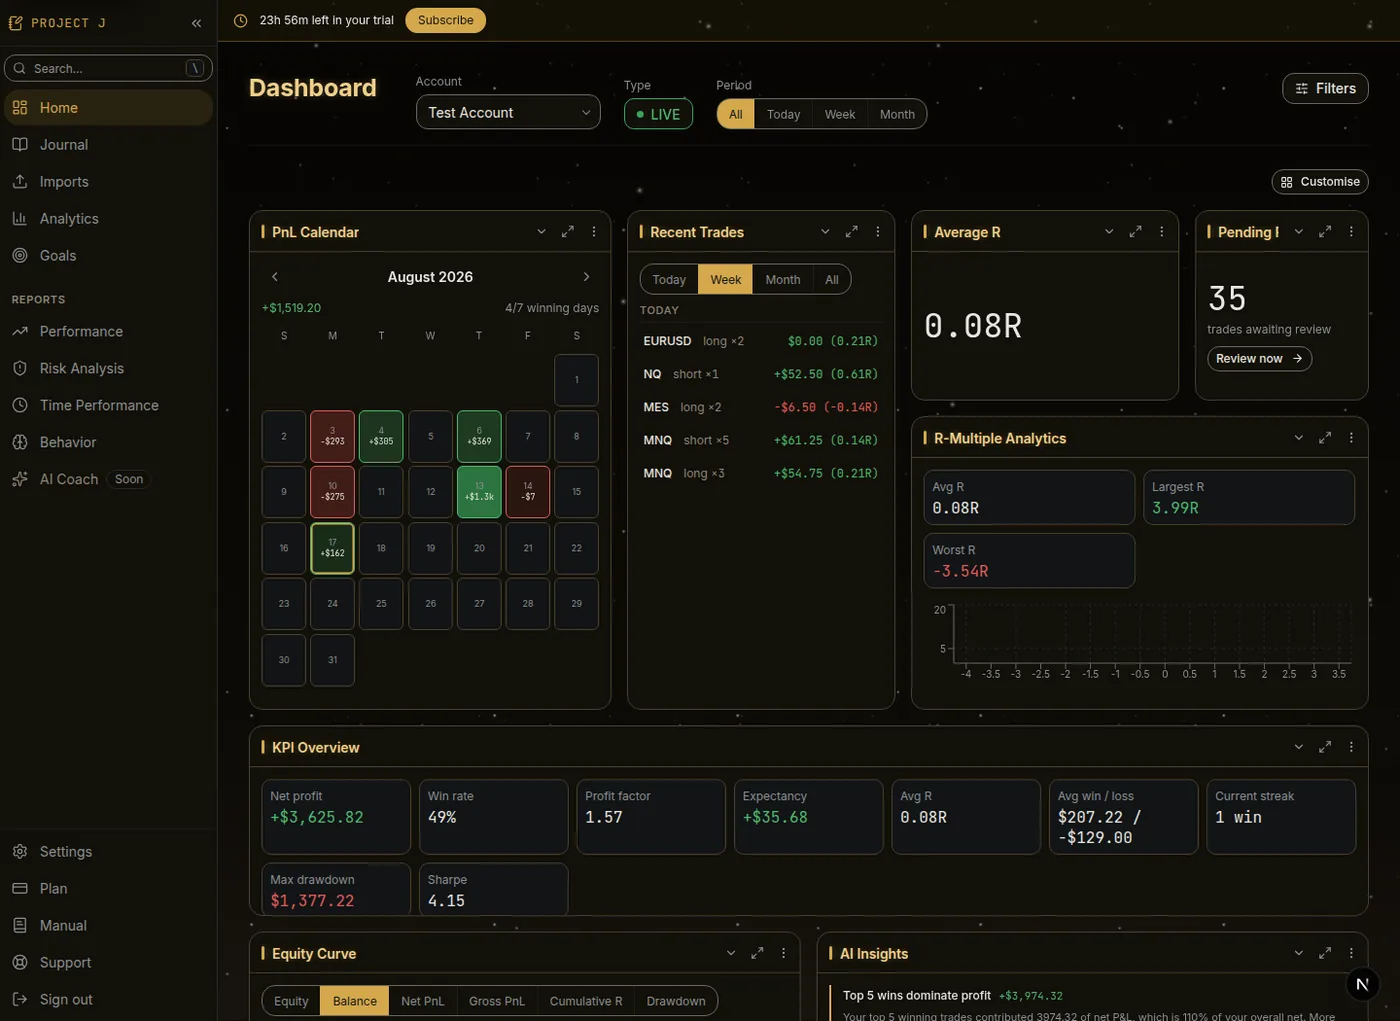
Home is a grid of widgets you arrange yourself.
Pick an account and a period (All, Today, Week, Month) at the top. Everything below responds. The Filters drawer narrows further by market type, instrument type, symbol and tag.
Press Customise to add, remove, resize, rearrange, rename, pin or collapse widgets. Undo and redo are available while customising, and Reset returns the board to its default. Layouts save automatically and are stored per account, so a prop account can look nothing like a live one.
You can also export a layout to a file and import it, which is the easiest way to copy an arrangement between accounts.
There are 37 widgets. See the widget reference.
6. Reports
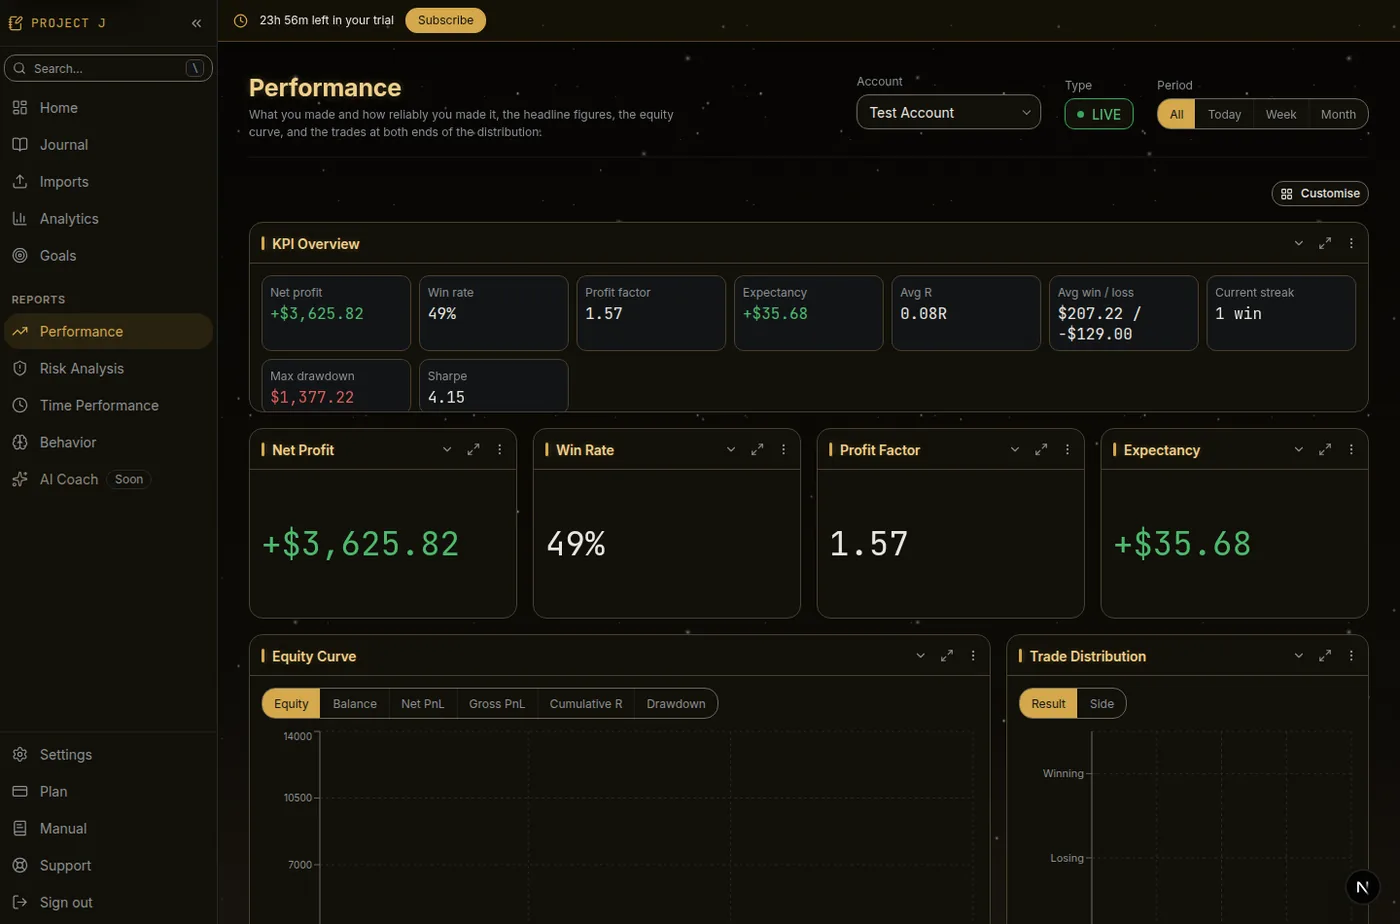
Four boards under Reports in the sidebar. Each is the same grid as Home, with a starting set of widgets chosen around one question:
| Board | The question it answers |
|---|---|
| Performance | What you made, and how reliably. Headline figures, equity curve, and the trades at both ends of the distribution. |
| Risk Analysis | What a bad run costs you. Drawdown, R-multiples, position sizing. |
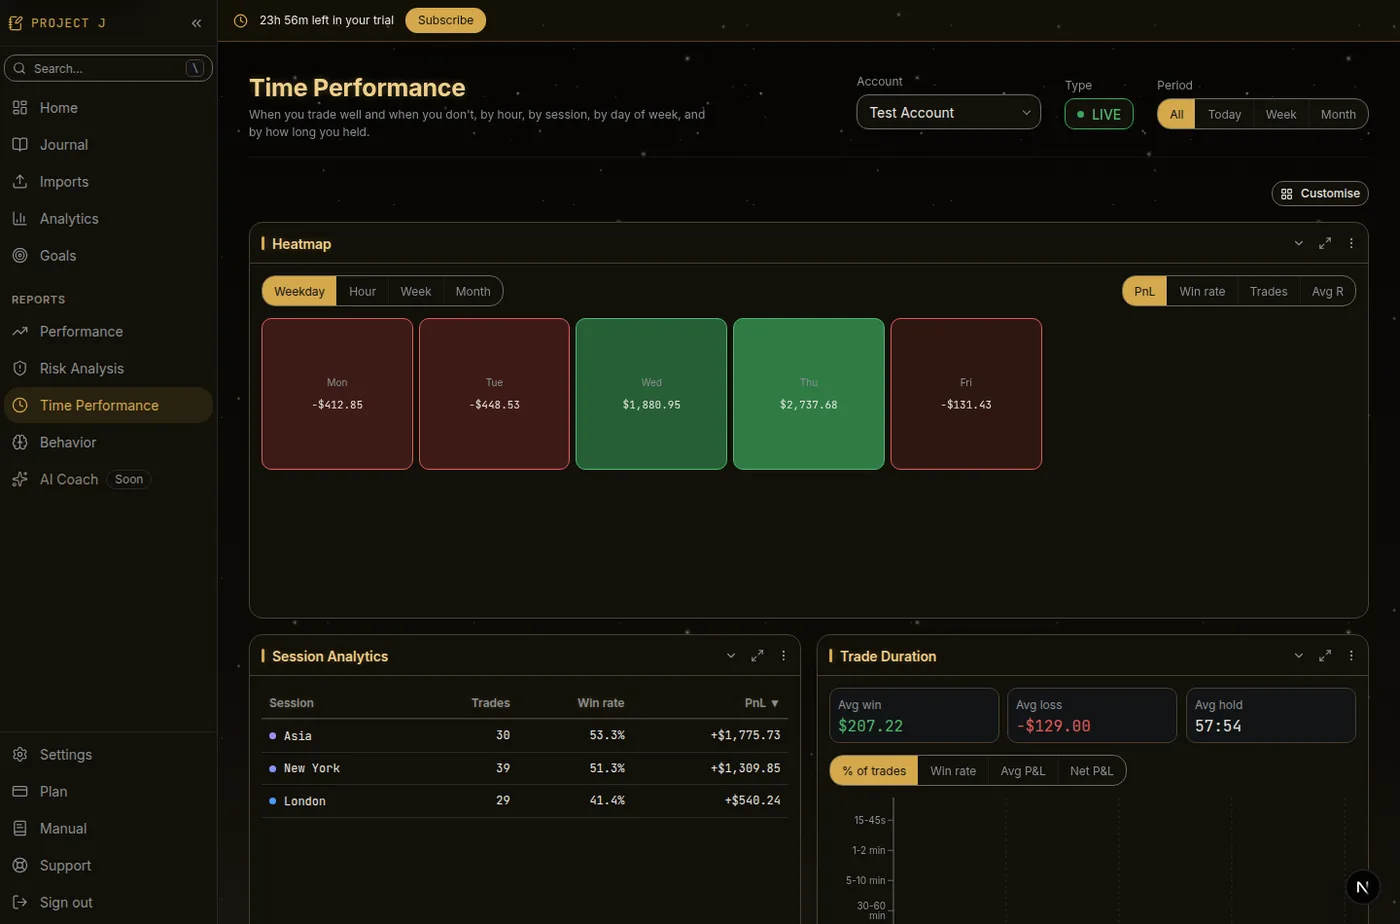
| Time Performance | When you trade well. By hour, session, weekday and holding time. |
| Behavior | The part that is not the strategy. Mistakes, emotional state, discipline, and the reviews you still owe yourself. |
Every board remembers its own arrangement, per account. The full widget library is available on all of them, so the starting sets are a starting point rather than a restriction. Customising Home never disturbs a report board, and the reverse.
Report boards filter by account and period. The wider Filters drawer is currently on Home only.
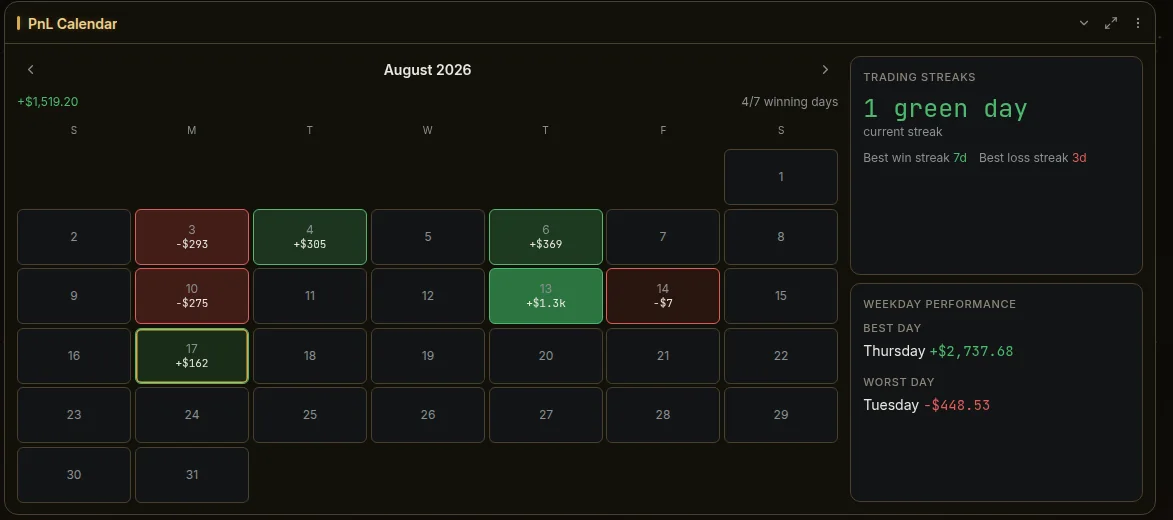
The P&L calendar
The calendar is a widget rather than a page. It ships on Home and on Time Performance, and you can add it anywhere.
A month at a glance: profitable days green, losing days red, deeper colour for larger amounts. Click a day to see the trades recorded on it.
Beside the calendar, or beneath it when the widget is narrow, are your current streak, your best winning and losing streaks, and your best and worst weekdays. If those panels are not showing, widen the widget: below a certain width the calendar keeps the space, on the grounds that a readable month beats two cramped summaries.
7. Analytics
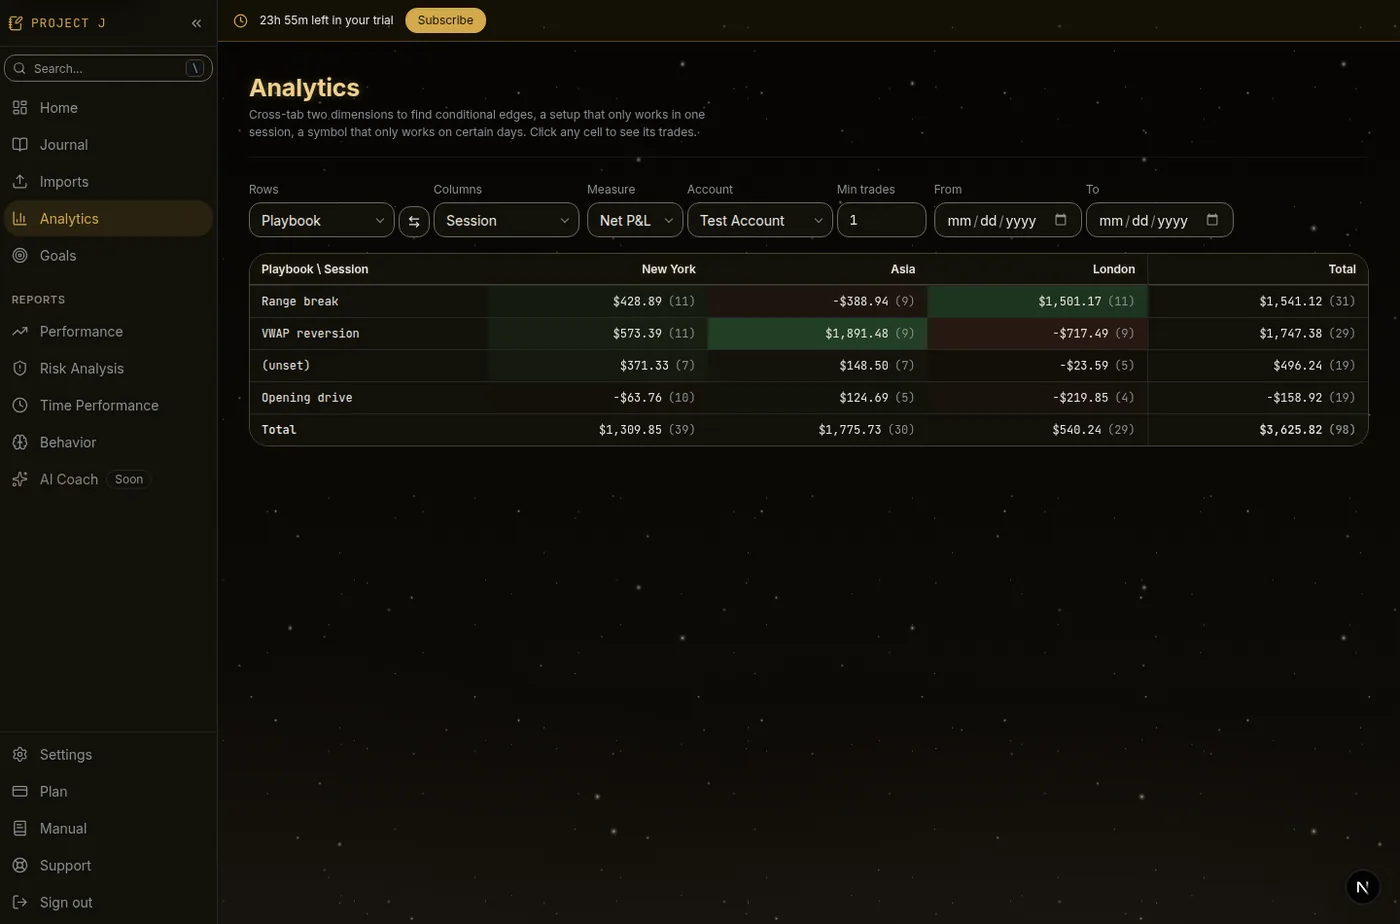
Analytics is the cross-tab explorer, and it answers a different kind of question from the widgets: not "how am I doing" but "where specifically does this work".
Choose a dimension for the rows, another for the columns, and a metric. Available dimensions include playbook, session, symbol, weekday, timeframe, market condition, emotion and mistake. Metrics include net P&L, win rate, average R and trade count.
Set a minimum trade count to suppress cells too thin to mean anything. Click any cell to see the trades behind it.
This is where conditional edges show up: a setup that only works in one session, a symbol that only works on certain days, a mistake that only costs you when you are tired.
8. Goals
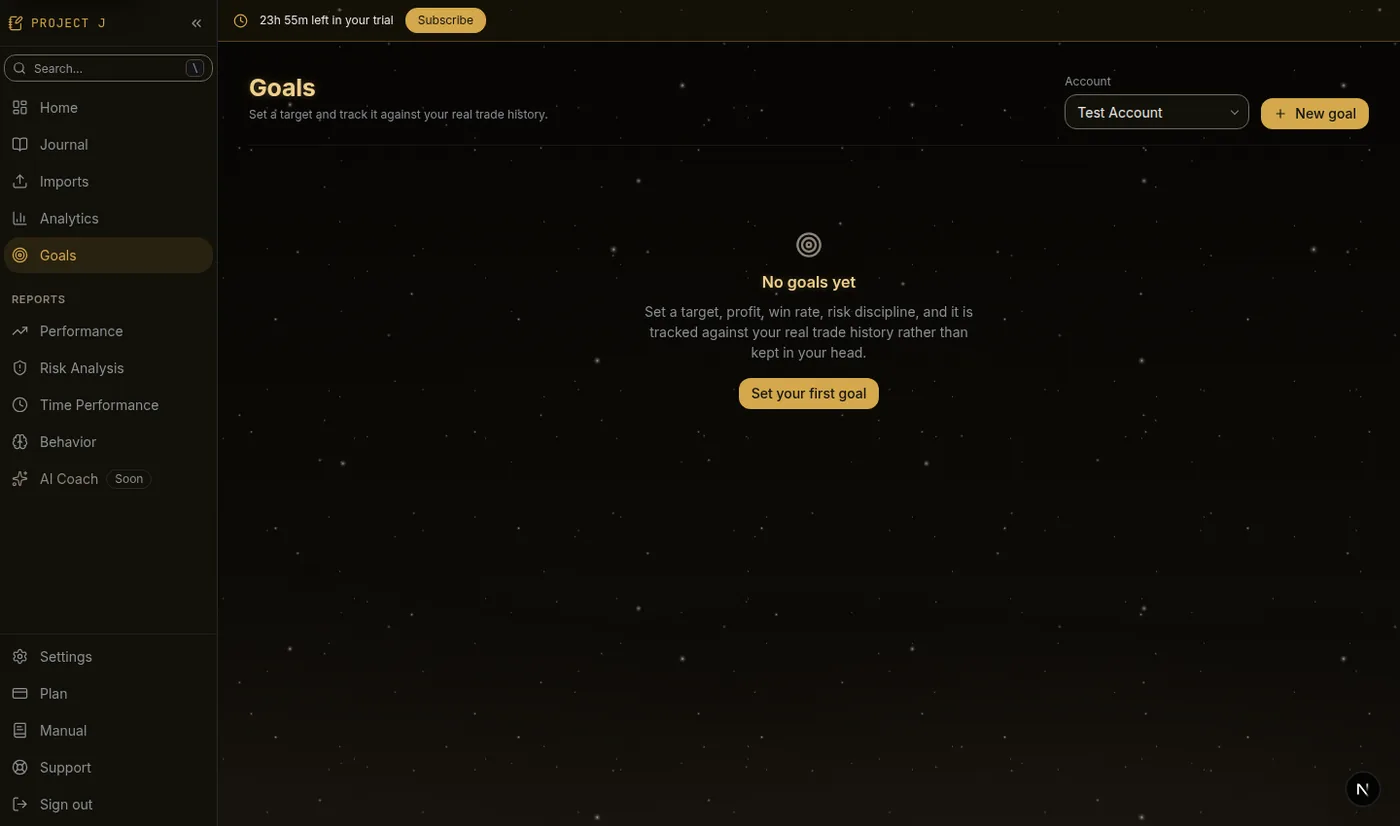
Goals sets targets and tracks them.
Pick a metric (net P&L, trade count, win rate, profit factor, average R, winning days), a period (week, month, quarter, year, all time), a direction (at least, at most) and a target. Progress is tracked against your real trades, per account or across all of them.
The Goals widget puts current progress on any board.
9. Journal library
Settings → Journal Library is where the vocabulary of your journal lives.
- Playbooks, your named setups. Attach one to a trade and playbook analytics starts working.
- Tags, free-form labels for anything you want to slice by later.
- Mistakes, the named errors you tag trades with. Mistake analytics prices each one.
- Emotions, the states offered in the trade review drawer.
Editing these changes what the drop-downs offer. Existing trades keep whatever they were tagged with.
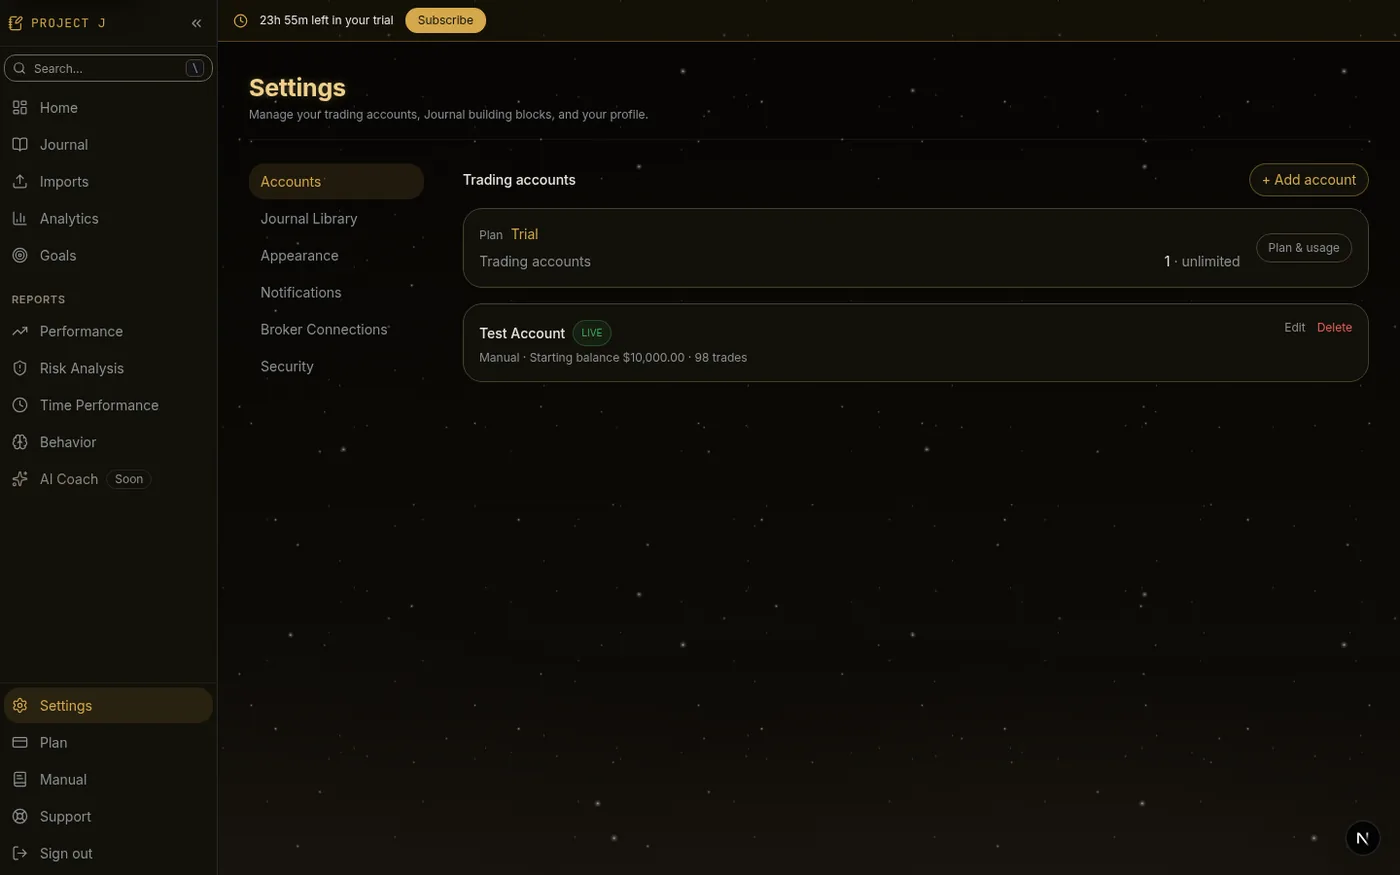
10. Settings
Six sections.
| Section | What is there |
|---|---|
| Accounts | Add, edit and archive trading accounts, and set prop-firm rules |
| Journal Library | Playbooks, tags, mistakes and emotions |
| Appearance | Theme and display currency |
| Notifications | What we email you about |
| Broker Connections | Direct broker links where supported |
| Security | Password, two-factor authentication, recovery codes, active sessions |
Appearance
Four themes: Classic, Dark, Instrument and Light, plus System to follow your operating system. The choice is stored on your account, so it follows you to another device.
Display currency changes the symbol and number formatting only. Amounts are never converted between currencies. If you trade US futures and set INR, you will see rupee symbols on dollar figures, which is a labelling choice rather than a conversion.
Security
Two-factor authentication uses an authenticator app. Turning it on gives you recovery codes, which are shown once. Store them somewhere you can reach without your phone.
Changing your password signs out other sessions.
11. Plan and billing
Plan shows your current status, what it includes, and what happens next.
The 24-hour trial needs no card. After it, a Pro subscription unlocks the product again. Payment is handled by Razorpay, in INR or USD, selected at checkout. Live prices are shown on the pricing page rather than quoted here.
Your data is never held hostage: export works whether you are trialling, subscribed or lapsed.
12. Support
Support raises a ticket and tracks the reply. Pick a category (bug, imports, billing, account, feature, other), describe the problem, and attach files if they help.
For an unrecognised broker export, attach a sample file. A few representative rows are enough, and you are welcome to redact anything you would rather not share. Several of the importers in the list above exist because somebody sent one.
13. Exporting your data
Journal → Export, or bulk-select trades and export the selection.
You get a CSV of your trades with the recorded fields. It works during the trial, while subscribed, and after a subscription lapses.
Dashboard and report layouts export separately, from Customise → Export on any board.
14. Widget reference
37 widgets. Add any of them to any board.
Performance
| Widget | Shows |
|---|---|
| Net Profit | Net P&L for the period, with trend against the previous one |
| Today's Performance | Net P&L, trade count and win rate for today, ignoring the period filter |
| Win Rate | Share of closed trades that won |
| Profit Factor | Gross profit divided by gross loss |
| Expectancy | Expected P&L per trade |
| Average R | Average R-multiple across trades with a stop loss |
| KPI Overview | Every core metric at once |
| Equity Curve | Growth over time: equity, balance, P&L or cumulative R, with drawdown |
| PnL Calendar | Monthly calendar by daily P&L, with streaks and best/worst weekday |
| Trade Distribution | Win/loss/breakeven and long/short splits |
| Largest Winners | Top 10 winning trades |
| Largest Losers | Top 10 losing trades |
| Monthly Comparison | This month against last |
Risk
| Widget | Shows |
|---|---|
| Drawdown | Maximum, average and current drawdown, and recovery time |
| Risk Analysis | Average risk and reward, risk:reward ratio, position sizing |
| R-Multiple Analytics | R summary and distribution histogram |
Behavior
| Widget | Shows |
|---|---|
| Trade Duration | Performance grouped by how long you held |
| Mistake Analytics | What each tagged mistake costs. Needs mistake tags |
| Emotion Analytics | Win rate and average P&L by logged emotion |
| Trading Health Score | A 0 to 100 composite of win rate, profit factor and drawdown control |
Market
| Widget | Shows |
|---|---|
| Heatmap | Trades, win rate, P&L or average R by weekday, hour, week or month |
| Session Analytics | Performance by trading session |
| Symbol Performance | Sortable breakdown by symbol |
| News | Not yet built |
| Economic Calendar | Not yet built |
Strategies, Journal, Goals and the rest
| Widget | Shows |
|---|---|
| Playbook Analytics | Performance by playbook |
| Tag Analytics | Performance by tag |
| Recent Trades | Your ten most recent |
| Pending Reviews | How many trades are unreviewed, with a link to the queue |
| Recent Notes | Your latest reflections |
| Goals | Progress against your targets |
| Achievements | Milestones unlocked from your real history |
| Broker Performance | Compare brokers. Needs two or more |
| Account Performance | Compare accounts. Needs two or more |
| AI Insights | Rule-based observations drawn only from your own trades |
| Consistency | Best and worst week and month, and average daily, weekly and monthly P&L |
| Import Status | Last import, rows imported and failed, and history |
15. Known limitations
Recorded here rather than discovered by surprise.
Futures from Charles Schwab and thinkorswim are understated. Both importers currently treat a futures contract as a single unit instead of applying the contract multiplier, so P&L on those trades is smaller than reality. Equities and options from the same files are correct. If you trade futures at either broker, check the figures after importing.
TradeStation support is beta. Its export format is not publicly documented. The importer reads a file consistently but has not been verified against a confirmed real export. Review the preview carefully.
News and Economic Calendar are placeholders. Both appear in the widget library and are marked as not yet built.
Report boards filter by account and period only. The market type, instrument, symbol and tag filters are on Home for now.
Display currency does not convert. It changes the symbol and formatting only.
16. Frequently asked questions
My broker is not in the list. Use Generic CSV, or map the columns manually and save the mapping. If you would like it supported properly, open a Support ticket under Imports and attach a sample export.
Why does a trade have no R-multiple? R needs a stop loss. Add one to the trade and R appears.
I imported the same file twice. Duplicates are detected against existing trades and within the file itself, and listed in the preview before anything is written. If a batch did get in twice, delete the whole import from the Imports page rather than removing trades one by one.
Why is my dashboard different on another account? Layouts are saved per account, and per board. That is deliberate: a prop evaluation and a live account rarely want the same widgets.
Where did the Calendar page go? It is a widget now, on Home and on Time Performance, with the streak and weekday panels alongside it. See Reports.
Can I get my data out? Yes, at any time, including after a subscription lapses. See Exporting your data.
Does this give trading advice? No. It organises and summarises what you record. Every number comes from your own data.